The 1,200-Watt Reality
Modeling the Standalone Value of Plug-In Solar in Northern Virginia
When Virginia passed House Bill 395, allowing plug-in solar systems up to 1,200 W starting January 1, 2027, it created a distinct class of distributed generation. Unlike traditional rooftop net-metered arrays, plug-in solar operates under strict physical and regulatory guardrails: it connects directly to a standard household branch circuit, bypasses utility interconnection review, and is explicitly excluded from net metering.
In Virginia, plug-in solar is strictly “use-it-or-lose-it.” Any generation not consumed behind your electric meter at the exact instant of production flows back into the distribution grid without credit.
This raises an immediate practical question for Northern Virginia homeowners and renters: Does an unbuffered 1,200 W plug-in system deliver enough real-world bill reduction to justify its upfront cost?
To answer this, I modeled a year of generation using historical weather and insolation data from Bailey’s Crossroads, Virginia (August 1, 2025 – July 31, 2026), paired against my actual split-phase residential load data downloaded from Dominion Electric Virginia.
The Fallacy of the “Average Day”
Financial models for solar often rely on annual averages. Over the modeled 12-month period, Bailey’s Crossroads received 1,568.57 kWh/m² of total daily solar insolation, translating to a daily mean of 4.30 kWh/m².
Note: This is the maximum possible energy that could be captured by a system, however solar system efficiency results in only being able to capture about ~15-20% of the solar energy.
A daily average of 4.30 kWh/m² might suggest a steady, predictable stream of energy (kWh). The real distribution tells a different story.
| Metric | Insolation (kWh/m²) |
|---|---|
| Maximum | 8.58 |
| 95th Percentile | 7.73 |
| 75th Percentile (Q3) | 6.07 |
| 50th Percentile (Median) | 4.09 |
| 25th Percentile (Q1) | 2.64 |
| 5th Percentile | 1.12 |
| Minimum | 0.30 |
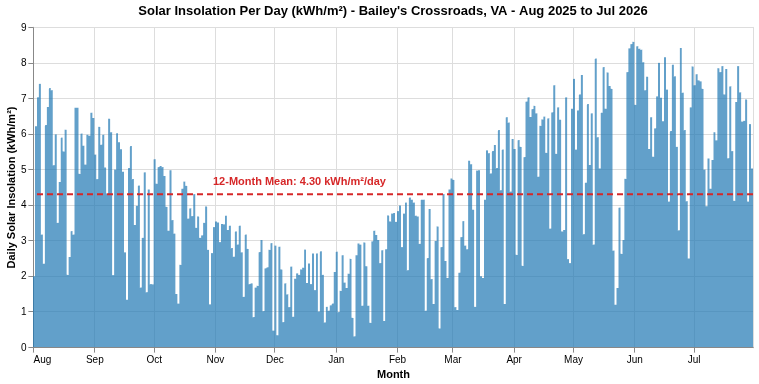
(Note: Visualizing the daily swing from 0.30 to 8.58 kWh/m² makes it obvious why designing around a simple mean fails.)
Sunlight arrives in feast-or-famine cycles, driven by seasonal changes and weather impacts to useful daylight, as well as changes in ambient temperatures impacting the silicon photovoltaic panels efficiency converting the irradiance into usable electricity.
Three Days, Three Realities
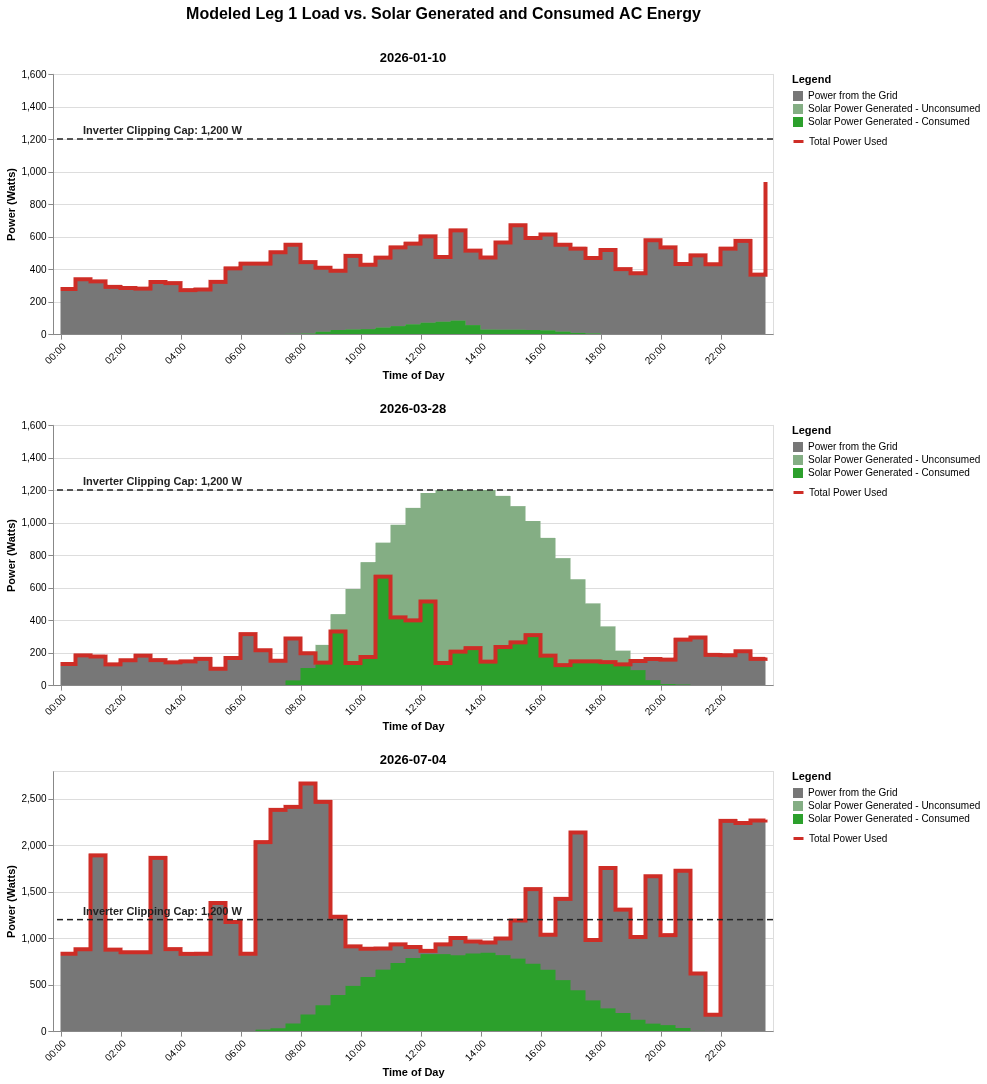
To evaluate how a standard 1,200 W array (plugged into Leg 1 of a standard 120/240V split-phase service) performs against household demand, consider three specific days from the model.
1. The Winter Floor: January 10, 2026
Heavy cloud cover, short daylight window, low ambient temperature.
On heavily overcast winter days, available irradiance collapses. On January 10, the array produced just 0.357 kWh DC, resulting in 0.339 kWh AC delivered to the household after inverter conversion losses.
- Household Context: Total household demand was 22.13 kWh (11.07 kWh on Leg 1).
- Grid Export: 0.00 kWh (0%).
- Demand Offset: The system offset 3.1% of Leg 1 demand, or 1.5% of total household energy.
There is zero waste here—every watt generated is consumed instantly by baseline appliances—but the raw offset is negligible.
2. The Spring Surplus Paradox: March 28, 2026
High irradiance, cool air temperatures 50-60°F (10-16°C), low household load.
March 28 represents prime operating conditions: high insolation paired with cool ambient temperatures that keep panels operating near peak electrical efficiency. The 1,200 W system produced 8.956 kWh AC, losing only 0.037 kWh to inverter clipping.
- Household Context: Mild weather meant no heating or cooling; total household consumption was just 10.05 kWh (5.03 kWh on Leg 1).
- Demand Offset: The array provided 2.704 kWh toward Leg 1 demand, covering 53.8% of that circuit's daily energy.
- Grid Export: 6.252 kWh (69.8%) flowed backward out of the home.
Under HB 395, this 6.25 kWh export earned exactly $0.00. It served neighboring loads on the local transformer while providing zero financial return to the system owner.
3. The Midsummer Thermal Penalty: July 4, 2025
Clear skies, high peak sun, ambient high temperature of 103°F.
July 4 delivered strong insolation (7.47 kWh/m²), well above the annual average. Under Standard Test Conditions (77°F / 25°C), a 1,200 W array would run near capacity for several hours. Instead, the system generated 6.699 kWh AC.
Why didn't generation peak at 1,200 W? Thermal derating.
Photovoltaic silicon exhibits a negative temperature coefficient of maximum power, typically degrading output by -0.35% to -0.45% per degree Celsius above 25°C. On a 103°F / 39.4°C summer afternoon, roof-level or balcony panel cell temperatures would routinely surpass 65°C (149°F), shedding 15% to 20% of rated nameplate capacity.
- Household Context: Air conditioning and continuous charging of the EV drove total household demand to 64.03 kWh (32.02 kWh on Leg 1).
- Grid Export: 0.00 kWh (0%).
- Demand Offset: The system covered 20.9% of Leg 1 demand (10.5% of total household demand).
EV charging was 1,440 W continuous throughout the day until after sunset, meaning that every kilowatt-hour generated by the 1,200 W array was consumed behind the meter. Note: EV charging is really only on one household leg but for this analysis it was split evenly between the two legs.
The Annual Economics: Does Standalone Plug-In Solar Pay Off?
A single day in March might make plug-in solar look inefficient, but energy economics depend on the entire 365-day balance sheet.
When modeling the full year against actual 30-minute interval smart meter data:
- Total Annual AC Generation (1,200 W system): 1,958 kWh
- Direct Self-Consumed Energy: 1,015 kWh (51.5%)
- Uncredited Grid Export: 943 kWh (48.20%)
Payback Calculation
In Northern Virginia, Dominion Energy’s residential Schedule 1 all-in rate sits at roughly $0.172 per kWh (including base generation, distribution, and fuel adjustments).
Annual Retail Savings: 1,015 kWh * $0.172 / kWh = $174.58
Capital Expenditure (CapEx): A quality, compliant UL 3700-certified 1,200 W balcony kit (three ~400 W panels, integrated microinverter, mounting hardware, and outdoor-rated disconnect cord) retails for roughly $1,000.
Simple Payback Period: $1,000 (system cost) / $174.58 (savings per year) = 5.73 years
Even without net metering credits and discarding more nearly 50% of production, the standalone 1,200 W system pays for itself well within the standard 20-to-25-year lifespan of standard solar hardware. For renters and homeowners alike, it serves as a viable, low-friction tool to reduce electric bills.
The total electricity consumption over the analytical period was 6,737 kWh. The 1,015 kWh self-consumed energy represents approximately 15% of total electricity used. If all of the generated electricity could have been self-consumed this would have represented approximately 29% of total energy usage, a not-insignificant increase in value.
The Unresolved Dilemma
While the baseline economics work, the data exposes an obvious structural inefficiency:
Summer and winter production are suppressed—winter by short, overcast days, and summer by thermal derating right when air conditioners demand peak power.
Spring production is heavily wasted, with roughly 70% of generation dumped back into the grid uncredited because midday baseloads on a single leg are too small to absorb it.
The standalone system works, but it leaves substantial energy on the table. In the next post, I examine what happens when you introduce behind-the-meter storage: Can a small, modular battery capture that 70% spring surplus and shift it into evening peak hours—and does the added hardware justify its cost?