How Much Power Can a Plug-In Solar Array Actually Produce?
(Modeling 1,200W vs. 1,500W in Virginia)
When exploring plug-in solar, a natural first question is: How much electricity will this system actually generate every day?
To answer this with mathematical precision rather than marketing guesswork, I modeled daily solar generation for my residence in Fairfax County, Virginia over a full 365-day year (August 2025 to July 2026). Using physics-based modeling and hyper-local historical weather data, here is what the data reveals about plug-in solar generation, the impact of panel “overpaneling,” heat penalties, and potential real-world saving.
1. Regulatory Context: Why the 1,200 W Inverter Cap?
Under Virginia’s plug-in solar law, residential plug-in solar devices up to 1,200 Watts DC per dwelling unit can be connected directly into standard 120V household wall outlets without formal utility pre-approval, interconnection fees, or complex electrical panel upgrades.
However, a solar array with a nameplate capacity of 1,200 W would rarely reach that limit due to weather effects (clouds, heat, or time of year). Commercial installations typically oversize their arrays about 25% to be able to reliably generate the expected amount of energy. Virginia’s plug-in solar law does not allow for oversizing but it’s an interesting analysis to see the extra value you would get from an oversized array with a microinverter that would limit the output to 1,200W.
2. The Modeling Setup: 1,200 W vs. 1,500 W Arrays
Using the physics-based Python pvlib library (implementing NREL’s benchmark PVWatts DC model) combined with 30-minute irradiance, ambient temperature, and wind speed data from the Open-Meteo API for Fairfax County, VA (38.85° N, -77.13° W), I simulated two fixed, South-facing (180° azimuth) arrays tilted at 38.85°:
- Baseline Array: 1,200 W DC nameplate capacity paired with a 1,200 W inverter (95% DC-to-AC efficiency).
- Oversized Array: 1,500 W DC nameplate capacity (25% more panel capacity) paired with the same 1,200 W max inverter output limit.
3. Average Daily Generation & Dollar Savings
Below is a graph of how much energy each system would produce based on an average of the days across the entire year:
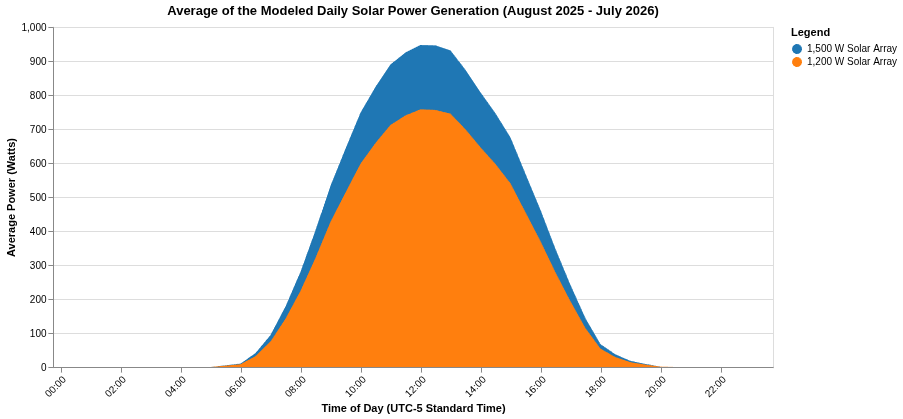
The table below gives greater detail and the expected savings if 100% of the generated, energy displaced electricity that otherwise would have been pulled from the grid.
| System Configuration | Raw Daily Generation (kWh) | Daily Output Limited to 1,200 W (kWh) | Energy Lost to Clipping | Estimated Daily Value ($0.18/kWh) | Estimated Annual Value |
|---|---|---|---|---|---|
| 1,200 W Solar Array | 5.344 kWh | 5.343 kWh | 0.02% | ~$0.96 / day | ~$350 / year |
| 1,500 W Solar Array | 6.683 kWh | 6.589 kWh | 1.41% | ~$1.19 / day | ~$432 / year |
Clipping occurs when the solar array outputs more power than enough power for the microinverter to produce 1,200 W AC. A legally compliant microinverter would limit the output to 1,200 W (clipping) so that the system remains compliant with the law.
My average cost of electricity is $0.18/kWh. However, this cost depends on total usage. In my county, we have three different categories of costs that scale differently: * Strictly Proportional Charges (generation, transmission, fuel, deferred fuel cost charge, sales and use surcharge, and state/local consumption tax scale linearly with consumption. * Partially Proportional Charges: distribution service charge consists of a fixed monthly customer charge plus a variable per-kWh rate. * Capped Non-Proportional Charges: County utility tax contains a fixed base fee plus a capped variable rate.
The Power of “Overpaneling”
By oversizing the panel array by 25% (1,500 W total panels feeding a 1,200 W max output), the total delivered daily output increases by 23.33% (from 5.34 kWh to 6.59 kWh per day). Even though peak midday generation exceeds the 1,200 W inverter limit on clear days. Based on this average output value, only 1.41% of total potential annual power would be lost to clipping.
4. Hardware & Purchasing Costs: Is Oversizing Worth It?
Retail rigid solar panels (300 W to 400 W nameplate ratings from major manufacturers like Renogy, BougeRV, Aptos, or EcoFlow) typically cost $120 to $180 per panel ($0.40–$0.55 per Watt).
- Baseline 1,200 W Hardware: Four 300 W panels (~$600 total panel cost).
- Oversized 1,500 W Hardware: Five 300 W panels (~$750 total panel cost).
Adding one extra 300 W panel costs approximately $150. At $0.18 per kWh, generating an additional 1.25 kWh per day provides $0.225/day ($82.12/year) in extra value. That extra panel pays for itself in under 20 months.
5. High vs. Low Days: The Counterintuitive “Heat Penalty”
Solar production isn't just a function of daylight hours; temperature plays a massive role due to the solar panel temperature coefficient (-0.0047 / °C).
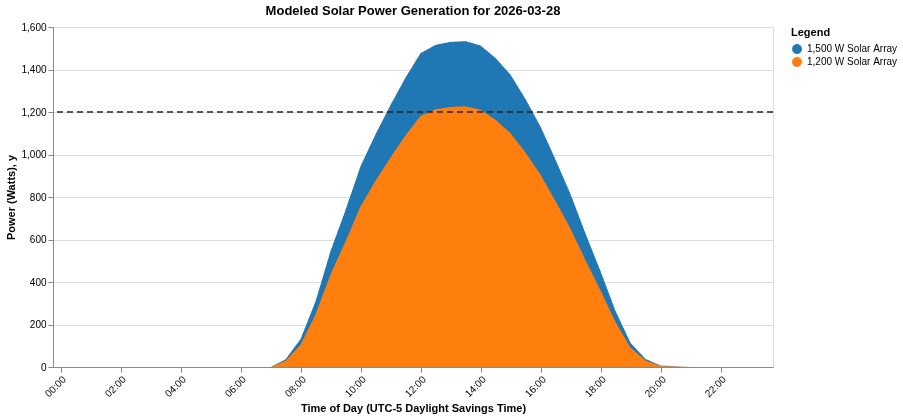
- Clear Spring Day (March 28, 2026 - High Temp 49°F):
- 1,200 W Array Output: 8.96 kWh (clipped)
- 1,500 W Array Output: 10.11 kWh (clipped)
- Cool ambient temperatures keep panel efficiency near maximum, yielding over 10 kWh in a single day!
- 1,200 W Array Output: 8.96 kWh (clipped)
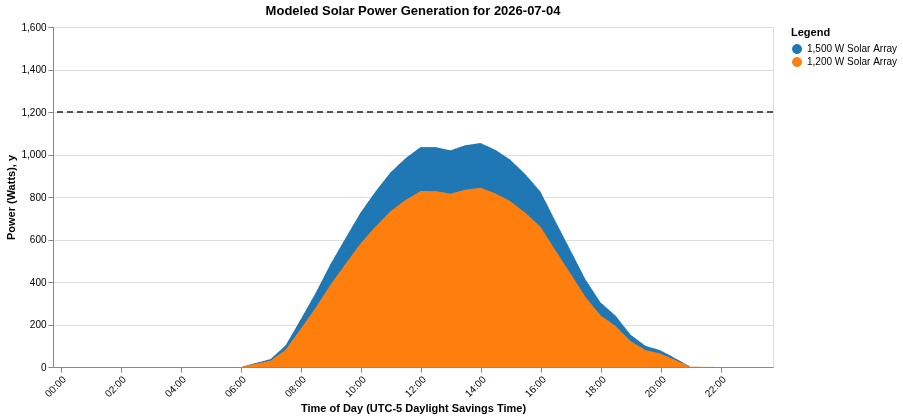
- Hot Summer Day (July 4, 2026 - High Temp 103°F):
- 1,200 W Array Output: 6.70 kWh
- 1,500 W Array Output: 8.37 kWh
- Extreme summer heat derates panel output, and atmospheric haze/humidity reduces solar intensity—producing about 75% of the daily output of a crisp spring day despite longer daylight hours!
- 1,200 W Array Output: 6.70 kWh
6. What's Coming Up Next: Real Household Demand Analysis
Knowing how much power your panels generate on paper is only half the battle. Because plug-in solar operates on a single 120V circuit leg without net metering, any power produced above your home's instantaneous demand flows out to the grid for free.
In my next post, I'll look at real smart meter data from my home! I'll analyze 30-minute interval electrical load profiles across single-phase circuits to calculate exact real-time self-consumption and uncompensated exports. Stay tuned!