What is the Potential Value of a Plug-In Solar System for My House?
Introduction
Evaluating the true potential of a plug-in solar system starts with understanding your actual household energy demand. To figure out whether a DIY plug-in solar setup makes sense for my home, I analyzed my electricity usage over a full 12-month period—from August 1, 2025 through July 31, 2026.
While utility billing cycles rarely align perfectly with calendar months, I used a linear regression cost model to overcome this. As discussed in my previous article on building an open data pipeline and cost impact model, this approach lets me calculate energy consumption and estimated costs for any custom date range with high accuracy.
Why Split Usage by 2?
A key technical detail when evaluating plug-in solar is how standard North American residential electrical panels work. Most homes receive 240V split-phase power divided into two separate 120V “legs” or lines. Because standard plug-in solar microinverters plug into a standard 120V wall outlet, they only feed power into one of those two legs.
To estimate how much electricity usage you can actually offset with solar generation, divide the total household energy usage by 2. While assuming electricity is split perfectly 50/50 between Leg 1 and Leg 2 isn't exact, it provides a reasonable baseline for a few reasons:
- High-demand appliances balance out: My peak energy months occur during the summer (June through August).
- 240V central air conditioning: The primary electrical load during summer is central AC, which runs on a 240V circuit and automatically draws power equally from both legs simultaneously.
Annual Usage Breakdown & Monthly Highlights
Here is the breakdown of my energy consumption across all 12 months, along with the estimated daily usage per leg:
| Month | Daily Energy Usage per Leg (kWh) | Total Energy Usage per Leg (kWh) | Cost per Leg | Effective Rate per kWh |
|---|---|---|---|---|
| August (2025) | 15.0 | 465.2 | $76.99 | $0.17 |
| September | 10.2 | 305.8 | $52.64 | $0.17 |
| October | 7.0 | 216.2 | $38.96 | $0.18 |
| November | 5.5 | 164.4 | $31.05 | $0.19 |
| December | 7.8 | 241.8 | $42.87 | $0.18 |
| January (2026) | 8.2 | 253.6 | $44.67 | $0.18 |
| February | 7.8 | 217.6 | $39.17 | $0.18 |
| March | 7.4 | 228.8 | $40.88 | $0.18 |
| April | 6.1 | 181.5 | $33.66 | $0.19 |
| May | 6.6 | 203.9 | $37.08 | $0.18 |
| June | 14.1 | 421.5 | $70.32 | $0.17 |
| July | 15.1 | 468.6 | $77.51 | $0.17 |
Looking at the monthly trends, November 2025 represented the lowest usage month of the year at 328.8 kWh total (an average of 5.5 kWh/day per leg). On the opposite end, July 2026 hit the highest usage peak at 937.2 kWh total (an average of 15.1 kWh/day per leg).
The total estimated cost for the single leg of energy over this 12-month period was $585.77. This figure represents the absolute maximum theoretical savings a plug-in solar system could have achieved under Dominion Energy Virginia's rate structure. Because a standard plug-in solar setup cannot generate enough electricity to fully offset this demand (even if oversized by 25%) this amount sets a firm ceiling on expected cost savings.
Seasonal Trends & HVAC Impact
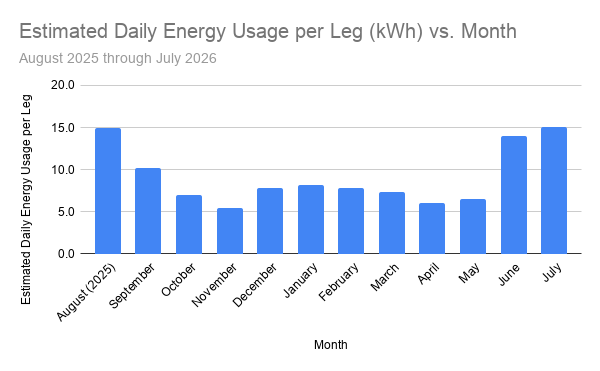
Energy consumption changes significantly across the seasons due to heating and cooling demands:
- Shoulder Seasons (Fall & Spring): During spring and autumn, my heating and cooling systems stay off most of the time. Opening windows handles temperature control, leading to the lowest electrical demand of the year.
- Winter Heating Demand: Because my home uses natural gas for primary heating rather than an electric heat pump, winter electricity demand remains modest. However, daily usage still rises compared to shoulder seasons because the furnace fan requires electric power to circulate warm air.
- Summer Peak Demand: Air conditioning drives the largest electricity load by far, doubling or tripling daily usage compared to spring and fall months.
Note: I started charging my EV at my house in June. Charging raised my total electricity usage for June and July but the overall trends for the year remain consistent, I’ve now just raised my baseline electricity usage.
Conclusion & What's Next
By analyzing a full year of energy consumption, I establish a clear understanding of the maximum impact a plug-in solar system can have. In the next post, I’ll demonstrate the grid-power offset potential of the previously modeled 1,200 W and 1,500 W systems at a more granular level and the expected payback periods.