Plug-In Batteries: Saving Excess Solar Production for Later
In my previous post, we established the economic baseline for an unbuffered 1,200 W plug-in solar system. The annual balance sheet works: even with zero net metering credits, an entry-level kit pays for itself in roughly six years.
However, that baseline analysis exposed an acute operational flaw: the shoulder-season surplus paradox. For example, on a sunny March day the modeled 1,200 W system would have produced 8.96 kWh of AC power, but Leg 1 household demand would only have absorbed 2.70 kWh. The remaining 6.25 kWh (69.8% of daily production) would have flowed out through the meter, uncredited onto the distribution grid. Under Virginia’s plug-in solar law’s “use-it-or-lose-it” rules, that power is a zero-dollar gift to the utility.
This brings us to the next phase of the evaluation: Adding a local battery to a plug-in solar array. A battery on a 120V plug-in circuit saves excess generation, allowing it to be used later as solar production wanes. However, the central question is not whether storage works, but whether the capital cost of adding kilowatt-hours of storage pays off by capturing that uncredited surplus.
Modeled System Setup
A 1200 W peak capacity solar array connected to an all-in-one AC-coupled plug-in solar plus storage system with:
- A microinverter
- Battery management system
- Current transformer (CT) clamps
Unlike traditional hybrid inverters that manage large central arrays, these units are module-level power electronics (MLPE) devices, converting direct current (DC) from solar panels into alternating current (AC) right at the source while simultaneously managing energy flow to a connected battery. The CT clamps allow measuring energy flows to and from the grid, so the system can prevent power export.
Some systems like this do exist, but they aren’t currently available to purchase in Virginia. I expect that to change after Virginia’s new plug-in solar law comes into effect January 1, 2027.
Modeling the Daily Capture Curve: The March 28 Benchmark
To evaluate how effectively battery storage preserves the economic value of excess generation, I ran an analysis of five storage sizes (1, 3, 5, 7, and 9 kWh) against a 24-hour period starting with the first solar generation on March 28, 2026.
To model realistic battery physics, I assumed an 80% usable Depth of Discharge (DoD) window (e.g., cycling between 10% and 90% state-of-charge to protect cell longevity). I chose the five battery sizes to demonstrate the incremental value gained from larger capacities:
| Battery Size (kWh) | Usable Capacity (kWh - 80% DoD) |
|---|---|
| 1 | 0.8 |
| 3 | 2.4 |
| 5 | 4 |
| 7 | 5.6 |
| 9 | 7.2 |
The boundary conditions for the modeled day were set by the smart meter readings from Dominion Power Virginia and the power generation curve using pvlib:
| Parameter | Value | Notes |
|---|---|---|
| Model Start | March 28, 2026 7:30:00 - 7:59:59 | The first period of solar production in the analyzed day |
| Model End | March 29, 2026 7:00:00 - 7:29:59 | Last period immediately preceding resumption of solar electricity generation in the modeled 24 hour period |
| 1,200 W Solar DC Generation | 9.47 kWh DC | 8.96 kWh AC potential |
| Daytime Leg 1 Demand | 2.70 kWh AC | 2.85 kWh DC consumed by inverter |
| Excess Solar Available to Shunt to Battery | 6.62 kWh DC | |
| Nighttime Leg 1 Demand | 2.08 kWh AC | Consumed across 21 intervals between sunset and sunrise |
| Total Leg 1 Demand | 5.26 kWh AC | 3.18 kWh daytime + 2.08 kWh overnight |
The model assumptions also included storing the excess energy directly as DC with a 95% round-trip efficiency. The DC electricity was only converted to AC to meet the needs of Leg 1 electrical demand, with a 95% efficiency across the AC inverter.
Household Power Leg 1 Modeled Results
| Battery Size (kWh) | Daytime Solar AC Energy Delivered (kWh) | Nighttime Battery AC Energy Delivered (kWh) | Total Energy Delivered (kWh) | Remaining Grid Reliance (kWh) |
|---|---|---|---|---|
| Solar-Only | 2.7 | 0 | 2.7 | 2.56 |
| 1 | 2.7 | 0.74 | 3.44 | 1.82 |
| 3 | 2.7 | 2.08 | 4.78 | 0.48 |
| 5 | 2.7 | 2.08 | 4.78 | 0.48 |
| 7 | 2.7 | 2.08 | 4.78 | 0.48 |
| 9 | 2.7 | 2.08 | 4.78 | 0.48 |
Due to high solar panel output in full sun and mild spring weather, combined with relatively low household energy consumption, a 3 kWh battery is sufficient to store enough energy to meet the overnight demand on leg 1 of the electrical system.
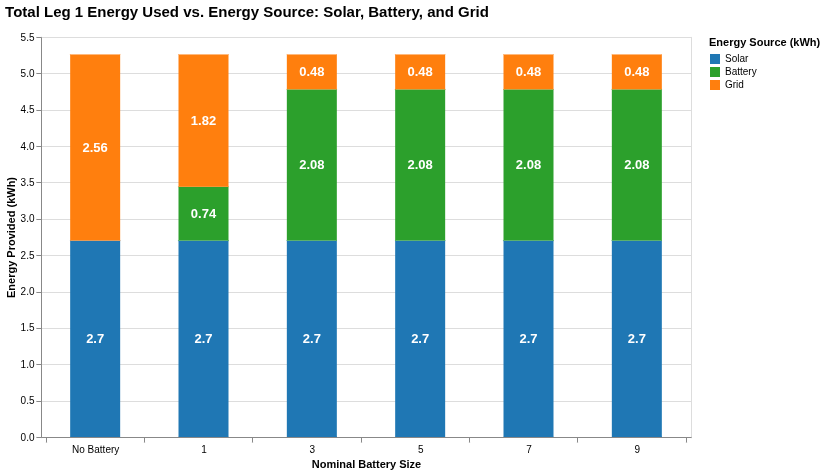
You’ll notice that even with the largest battery size, the household system still imported 0.48 kWh from the grid for Leg 1. This occurs because the scenario begins with the battery at 0% state of charge. As the sun rises, initial solar production is insufficient to cover Leg 1 usage, resulting in 0.48 kWh imported before solar generation overtakes demand.
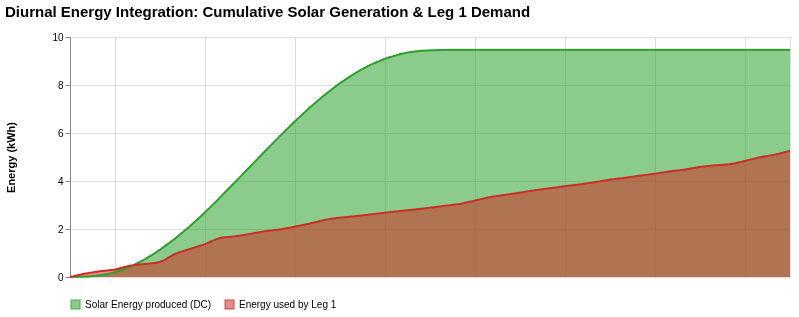
The above graph shows the total energy generated by the solar panels (green area) relative to total energy consumption (red area) throughout the day, clearly demonstrating the significant excess production by the solar panels.
The below graph shows the state of charge of the different battery storage sizes modeled and their ability to capture the excess energy. The accumulation rises throughout the day, up to the system limits and begin discharging to leg 1 as solar production dips below demand.
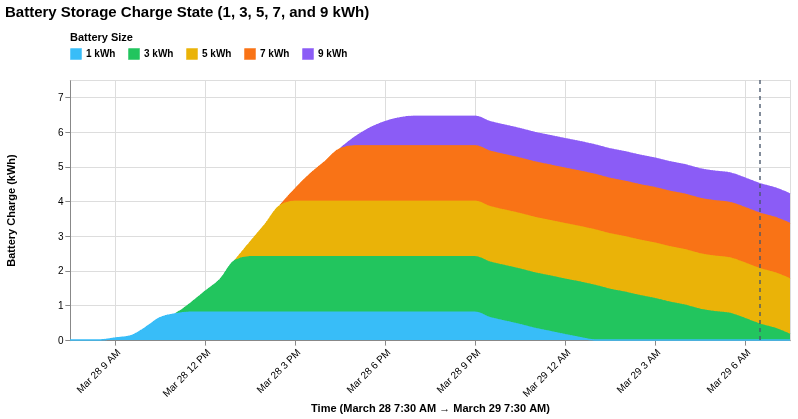
The battery state of charge shows the profile of energy accumulation during the day and subsequent discharge overnight to meet household demand on leg 1. The 3 kWh battery was the minimum size necessary to store enough energy to provide 100% of the overnight energy use on leg 1. The 9 kWh battery was the only system able to capture 100% of the excess generated energy. However, due to the limited power usage in the scenario, much of the excess would need to be used on subsequent days for it all to be consumed.
| Battery Size (kWh) | Percent of DC Surplus Captured | Percent of Overnight Demand Met | Percent of Leg 1 Demand Met | Percent of Total Household Energy Demand Met |
|---|---|---|---|---|
| Solar-Only | 0.0% | 0.0% | 51.4% | 25.7% |
| 1 | 12.4% | 35.7% | 65.5% | 32.8% |
| 3 | 37.2% | 100.0% | 90.9% | 45.5% |
| 5 | 62.0% | 100.0% | 90.9% | 45.5% |
| 7 | 86.8% | 100.0% | 90.9% | 45.5% |
| 9 | 100.0% | 100.0% | 90.9% | 45.5% |
Insights
- Near-Total Leg 1 Self-Sufficiency: On a temperate day, when the household energy demand is low, adding modest storage transforms the performance of the branch circuit. A 3 kWh battery is sufficient to enable meeting 90.9% of leg 1 energy demand on the modeled day.
- The Single-Leg Saturation Ceiling: The 1,200 W solar array actually generated more power than the total household consumption for the analysis period. This highlights the fundamental limitation of a single-circuit plug-in architecture, even if storage eliminates 100% of Leg 1's grid reliance, on mild, sunny days the array would generate more energy than that single circuit would use.
While batteries significantly enhance the value of a photovoltaic system during shoulder seasons, how long would it take for utility savings to offset the initial investment? My next post will analyze year-round performance and system economics.